CIS 375 SOFTWARE ENGINEERING

UNIVERSITY OF MICHIGAN-DEARBORN

DR. BRUCE MAXIM, INSTRUCTOR

Date: 9/22/97

Week 3

DYNAMIC ESTIMATION MODELS:

  1. Putnam Model (initially based on 200 military models).
  2. (Rayliegh curve -> skewed, median & mean offset from one another).

  • Based on:
    1. Volume of work.
    2. Difficulty gradient (complexity).
    3. Project technology factor.
    4. Time constraints, delivery.
  • E = y() = 0.3945 K;
  • { represents optimal time} {K represents the area under the Rayliegh curve}.
  • D = K / 2;
  • {difficulty measure based on 2 and K}.
  • P = C2D-2/3;
  • {productivity measure}.
  • Ss = c K-1/5 4/3;
  • { lines of code measure} {c represents the technology factor from survey}.

    1. Parr Model (variation of above):
    2. Staff (t) = sech2 [(a t + c)/2].

    1. Jensen Model:
    2. (less sensitive to compression)
    3. Ss = Cte T K 1/2
    4. { Cte represents technology constraint with environmental adjustment}.
    5. COPMO (cooperative programming model):
    6. E = E1 (S) + E2 (m);
    7. {E represents total effort}.
    8. {E1(S) represents the effort of one or people working independently
    9. E1(S) = a + bs ,where a & b are empirically derived constants}.
    10. {E2(m) represents the effort required to coordinate the development process
    11. E2(m) = cm2 where m is the average number of team members}.

    MAKE-BUY-DECISION:

    1. Is a computer-based necessary (cost effective?):
    2. Can an existing software package be purchased for the task?

    DECISION STEPS:

    1. Develop specifications.
    2. Estimate internal cost & delivery.
    3. Select 3 or 4 candidate packages.
    4. Select reasonable components.
    5. Build a cost-benefit comparison matrix, or Benchmarking (if from scratch you can't do this).
    6. Evaluate each software package or component based on history with the product or vendor.
    7. Contact other users.
  • Now you're in a good position to evaluate.
  • One way: build a decision tree.
  • RISKS ANALYSIS:

    1. Risk identification.
    2. Risk projection (impact of risks/likelihood of risk actually happening).
    3. Risk assessment (the change if it happens).
    4. Risk management.

    KINDS OF RISK:

    RISK PROJECTION (OR ESTIMATION):

    RISK PLANNER:

    1. Establish a scale indicating perceived likelihood.
    2. Determine consequences.
    3. Estimate impact on project (for each risk).
    4. Note overall accuracy of risk projection (to avoid misunderstanding).

    Date: 9/24/97

    Week 3

    SAMPLE IMPACT ASSESSMENT TABLE:
    CATEGORY \ COMPONENTS
    PERFORMANCE
    SUPPORT
    COST
    SCHEDULE

    1

    Failure to meet would result in mission failure
    Failure results in increased costs and schedule delays with expected values in excess of $500K
    CATASTROPHIC

    2
    Significant degradation to nonachievement of technical performance Nonresponsive or unsupportable software Significant, financial shortages, budget overrun likely
    Unachievable delivery date

    1
    Failure to meet the requirement would degrade system performance to a point where mission success is questionable Failure results in operational delays and/or increased costs with expected value of $100K to $500k
    CRITICAL

    2

    Some reduction in technical performance

    Minor delays in software modifications
    Some shortage of financial resources, possible overruns
    Possible slippage in delivery date

    1
    Failure to meet the requirement would result in degradation of secondary mission Costs, impacts, and/or recoverable schedule slips with expected value of $1K to $100K
    MARGINAL
    2
    Minimal to small reduction in technical performance Responsive software supportSufficient financial resources Realistic, achievable schedule

    1
    Failure to meet the requirement would create inconvenience or nonoperational impact Error results in minor cost and/or schedule impact with expected value of less than $1K
    NEGLIGIBLE
    2
    No reduction in technical performance Easily supportable softwarePossible budget underrun Early achievable date

    RISK PROJECTION:

    1. List all risks listed in column one.
    2. Categorizes risks by type:

    {business, project, etc.}

    1. Probability value (guess).
    2. Impact.
    3. Sort table based on impact and probability.

    RISK ASSESSMENT:

    1. Define referent levels.

    {break even points - cost/schedule)

    1. Develop relationships between each reference factor.
    2. Determine region of termination, bounded by uncertainty curve.
    3. Try to predict compound combinations of risks - affecting referent level.

    RISK MANAGEMENT (MONITORING):

  • (No way to avoid risk)
    1. Determine causes of job turnover.
    2. Eliminate causes before project starts.
    3. After project starts, assume turnover is going to occur and ensure continuity.
    4. Make sure teams are organized and distribute information widely.
    5. Define documentation standards and be sure documents are produced in a timely manner.
    6. Conduct peer review of all work.
    7. Define backup staff.

    CUSTOMER QUESTIONS

    1. Do you understand my needs?
    2. Can you design a system to meet my needs?
    3. How long will it take?
    4. How much will it cost?

    PROJECT SCHEDULE

  • (Break into phases)
    1. Deliverables:
    2. Milestones:
    3. Completion of an activity of delivery (must be measurable).
    4. Milestones must have definite a start and stop.
    5. Work breakdown structure:
    6. Separate project development into phases, composed of steps (series of activities).

    DIGRAPH = ACTIVITY GRAPH.

  • Activities :
    1. Precursor.
    2. Duration.
    3. Due date.
    4. End point.
  • CRITICAL PATH METHOD:


  • Activity
  • Precursor
  • Duration
  • EST
  • EFT
  • LST
  • LFT
  • Slack
  • Start
  • -
  • 0
  • 0
  • 0
  • 0
  • 0
  • 0
  • A
  • Start
  • 2
  • 0
  • 2
  • 0
  • 2
  • 0
  • B
  • Start
  • 3
  • 0
  • 3
  • 4
  • 7
  • 4
  • C
  • A
  • 5
  • 2
  • 7
  • 2
  • 7
  • 0
  • D
  • A,B
  • 4
  • 3
  • 7
  • 7
  • 11
  • 4
  • E
  • D
  • 2
  • 7
  • 9
  • 11
  • 13
  • 4
  • F
  • B,C
  • 6
  • 7
  • 13
  • 7
  • 13
  • 0
  • FINISH
  • E,F
  • 0
  • 13
  • 13
  • 13
  • 13
  • 0
  • Critical Path is when all slack times = 0.
  • PERT:

  • (Program evaluation review technique)
  • JAN
  • FEB
  • TASK
  • EARLIEST START
  • LATEST START

  • 1

  • 8

  • 15

  • 22

  • 29

  • 5

  • 12

  • 17

  • 24
  • 1
  • 1/1
  • 2/5
  • *
  • *
  • *
  • *
  • *
  • *
  • 2
  • 1/1
  • 1/8
  • *
  • *
  • 3
  • 1/9
  • 1/22
  • *
  • *
  • *
  • *
  • 4
  • 1/9
  • 1/22
  • *
  • *
  • *
  • *
  • 5
  • 1/23
  • 2/1
  • *
  • *
  • *
  • 6
  • 1/23
  • 2/1
  • -
  • -
  • F
  • 7
  • 1/23
  • 2/17
  • -
  • -
  • F
  • F
  • F
  • 8
  • 2/2
  • 2/17
  • *
  • *
  • *
  • *
    1. Gant Charts:

    1. Overlay People On Gant Chart:

    1. Milestone Chart:

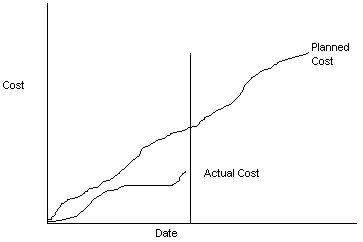
    1. Line Graph:

    PRESSMAN'S PROJECT PLAN:

    1. Project scope.
    2. Project schedule.
    3. Project team organization.
    4. Technical description of proposed system.
    5. Project standards, procedures, proposed methodologies.
    6. Quality assurance plan.
    7. Special tools & techniques.
    8. Configuration management plan.
    9. Documentation plan.
    10. Data management plan.
    11. Resource management plan.
    12. Test plan.
    13. Training plan.
    14. Security plan.
    15. Maintenance plan.